
2026 EIS Battery Testing Trends and Tool Checklist
Battery teams enter 2026 under pressure. Faster-charging chemistries, solid-state cells, and stricter safety rules are compressing validation timelines everywhere.
Electrochemical impedance spectroscopy sits at the center of that shift. Embedded EIS now moves diagnostics from the lab bench into live battery management systems, while multichannel instruments shorten sweeps dramatically.
This guide maps the trends reshaping impedance testing and translates them into a practical tool checklist. You will learn which instruments, fixtures, and shielding practices protect data quality as your laboratory scales.
Why EIS Battery Testing Matters More Than Ever in 2026
Battery validation now carries regulatory weight that few laboratories anticipated a decade ago. Regulators and manufacturers treat early degradation detection as a safety obligation, not a research luxury.
EIS answers questions that voltage and current readings cannot. A single frequency sweep resolves ohmic resistance, charge-transfer kinetics, and diffusion behavior without dismantling the cell under test.
Fast-charging demands and next-generation chemistries sharpen that need. Cells pushed to extreme charge rates degrade through distinct mechanisms, and impedance spectra expose those mechanisms long before capacity loss becomes visible.
Non-destructive insight also protects expensive samples. Teams can track aging across hundreds of cycles while preserving every cell for continued study.
Embedded EIS in Battery Management Systems Reshapes Real-Time Diagnostics
Battery management systems in 2026 increasingly integrate impedance measurement directly onto their monitoring boards. Onboard excitation circuitry injects small currents, then captures the voltage response across each cell.
This shift allows pack-level diagnostics to run continuously during normal operation, not just during scheduled laboratory sessions. Engineers can now track resistance growth and early degradation signatures in real time.
Fleet operators benefit most, since every connected pack becomes a continuous data source.
Hardware constraints and multi-source noise remain significant obstacles, however.
Careful filtering and calibration separate genuine impedance changes from switching artifacts and thermal drift.
Faster Frequency Sweeps and Multichannel Instruments Cut Test Time
Modern frequency response analyzers sweep from millihertz to kilohertz in minutes rather than hours. Faster sweeps let laboratories run full impedance profiles on every cell instead of a sampled subset.
Multichannel instruments multiply that gain by testing dozens of cells in parallel under identical conditions. Parallel channels also remove run-to-run drift, because reference cells and test cells share the same thermal environment and time stamp.
The payoff is statistical power. Larger sample sizes expose cell-to-cell variation that single-channel workflows hide, so qualification decisions rest on distributions rather than anecdotes.
Throughput gains compound across a full qualification campaign.
Solid-State and Fast-Charging Chemistries Demand New EIS Protocols
Solid-state cells push impedance measurement into unfamiliar territory, where electrolyte interfaces dominate the spectrum and ohmic resistance tells only part of the story. Protocols inherited from liquid-electrolyte cells often miss the low-frequency processes that reveal contact degradation.
Fast-charging formats add pressure in the opposite direction, demanding short, high-current pulses that stress the cell while sweeps run. Analysts increasingly extend sweeps below 10 mHz, reduce excitation amplitude to a few millivolts, and apply DC bias to mimic real charging states.
Standardizing these parameters early keeps data comparable across laboratories as these chemistries mature.
Choosing the Right Potentiostat and Frequency Response Analyzer in 2026
Match the potentiostat to your real cells, not to a headline frequency spec.
In 2026, prioritize current resolution and phase accuracy.
Stable low-frequency performance under load matters more than a 10 µHz claim.
Multichannel instruments shorten campaigns, but confirm channel isolation and synchronized chamber control.
Ask for a demonstration using your reference cells.
Verify software exports raw impedance data and supports batch fitting.
Choose an analyzer your team can calibrate, audit, and trust across chemistries.
Calibration, Reference Electrodes, and Cable Shielding Practices That Protect Data
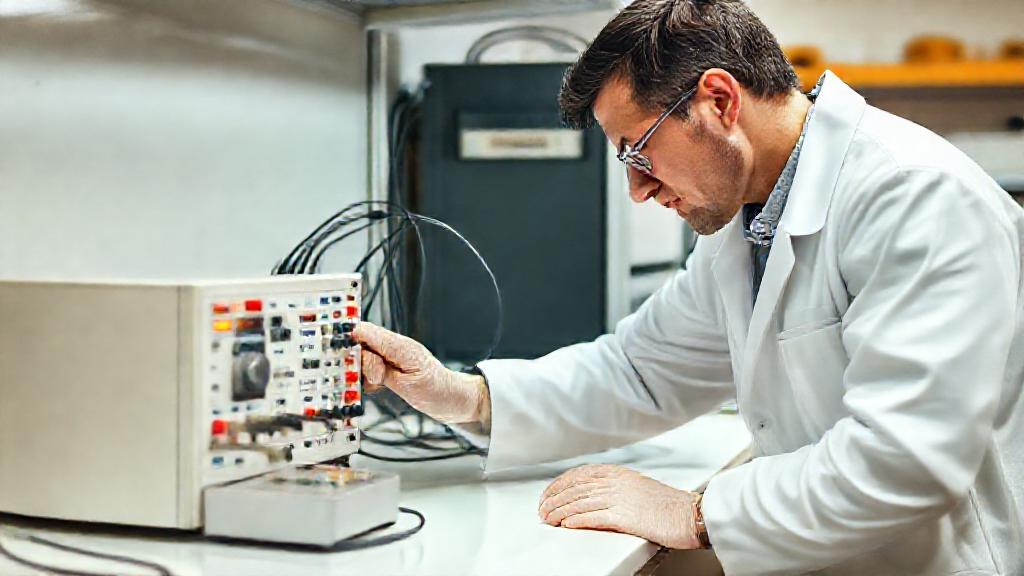
Schedule impedance calibration against certified reference standards before every critical campaign. Drift in the frequency response analyzer corrupts Nyquist data.
Log calibration dates and flag instruments overdue for service.
Reference electrode stability matters most in three-electrode cells.
Inspect junctions for drying, store electrodes in matching electrolyte, and replace any showing shifted open-circuit potential.
Route shielded, low-noise coaxial cables away from power supplies and inverters.
Ground shields at one end to avoid loops, and verify continuity before each run.
These habits preserve phase accuracy across repeated campaigns.
Document every adjustment so audited results remain traceable.
Temperature-Controlled Test Fixtures Improve Impedance Measurement Repeatability Across Cycles
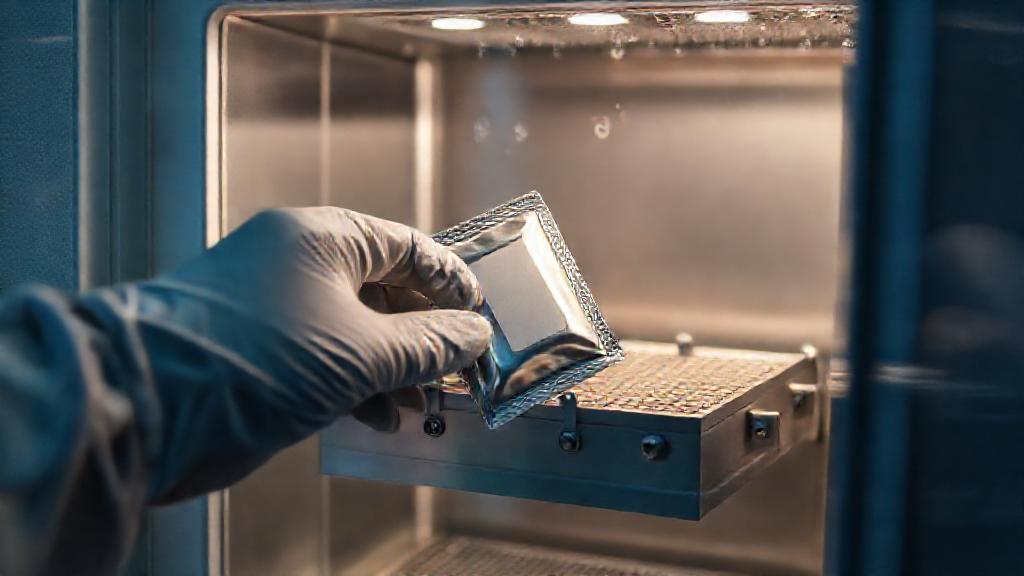
Impedance is exquisitely temperature-sensitive: a single degree shift can move charge-transfer resistance by several percent, masking the ageing signal you set out to measure.
1 °C, using Peltier stages or forced-air chambers so consecutive spectra overlay cleanly.
Fixtures also shorten settling time between cycles, which matters during long ageing campaigns where hundreds of spectra are collected back to back.
Allow thermal equilibration before each sweep and log fixture temperature with every dataset; those two habits convert cycle-to-cycle scatter into defensible trend lines.
From Nyquist Plots to Actionable Insight: Interpreting Impedance Spectra
Nyquist plots remain the fastest route from raw impedance data to diagnostic meaning. The high-frequency intercept reveals ohmic resistance, while semicircle width tracks charge-transfer resistance.
Low-frequency tails, in turn, signal diffusion limitations inside the electrode. Fit an equivalent circuit model, but validate it against reference cells first.
Distribution of relaxation times analysis is now used widely in 2026. It separates overlapping processes that simple equivalent circuits quietly merge together.
Compare spectra across cycles instead of judging any single measurement. A widening semicircle flags rising interfacial resistance; a growing tail often precedes capacity fade.
Building a 2026 EIS Tool Checklist for Your Battery Laboratory
No single instrument defines a capable impedance laboratory in 2026. A practical checklist balances analyzer performance, environmental control, and data hygiene at every measurement stage.
- Potentiostat and frequency response analyzer with sub-milliohm resolution and sweeps to 1 MHz
- Multichannel switching for parallel cell and module testing
- Temperature-controlled fixtures rated from −40 °C to +60 °C
- Shielded, low-inductance cabling paired with verified reference electrodes
- Embedded EIS validated against a certified calibration cell
- Software with automated equivalent-circuit fitting and audit-ready reporting
Revisit the checklist annually, because chemistries, safety standards, and instrument firmware evolve quickly.
EIS in 2026 rewards capable hardware paired with disciplined practice. Embedded diagnostics, faster multichannel sweeps, and protocols for solid-state and fast-charging cells set the pace.
Calibration routines, shielded cabling, stable reference electrodes, and temperature-controlled fixtures keep impedance data repeatable. Audit your bench against the checklist and prioritize gaps affecting measurement confidence.
Review potentiostat, frequency response analyzer, and fixture stability before your next campaign. Explore EIS testing resources to match instrumentation to your laboratory’s 2026 goals.